Poorest countries to be hit hardest by climate change
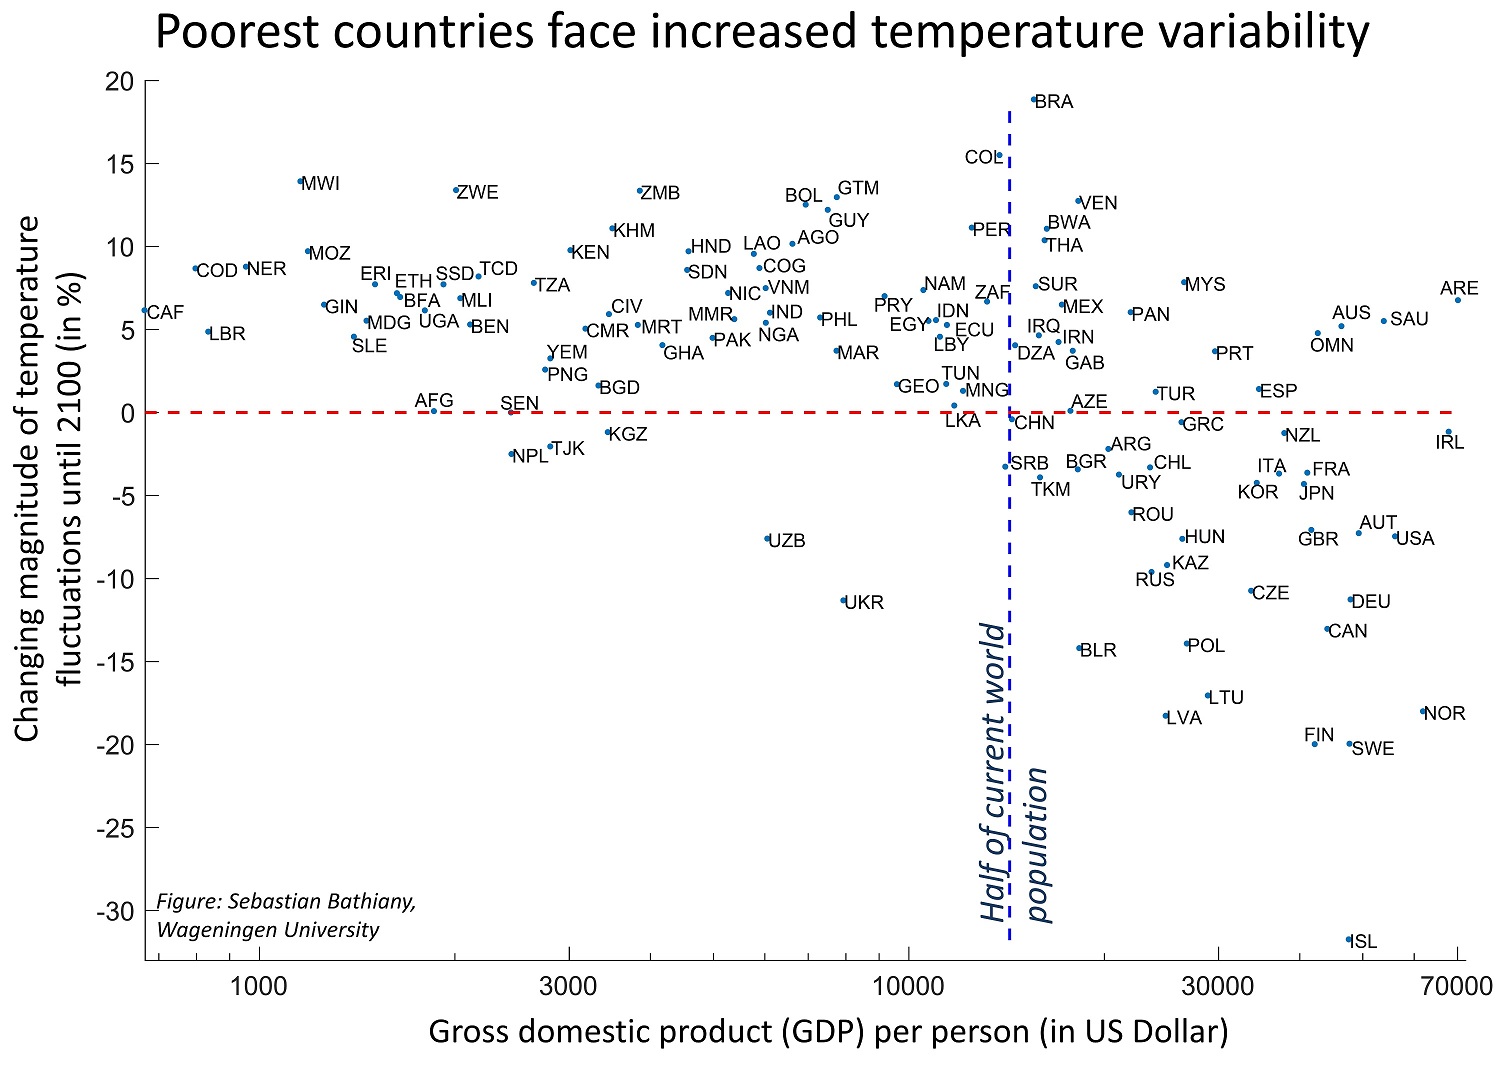
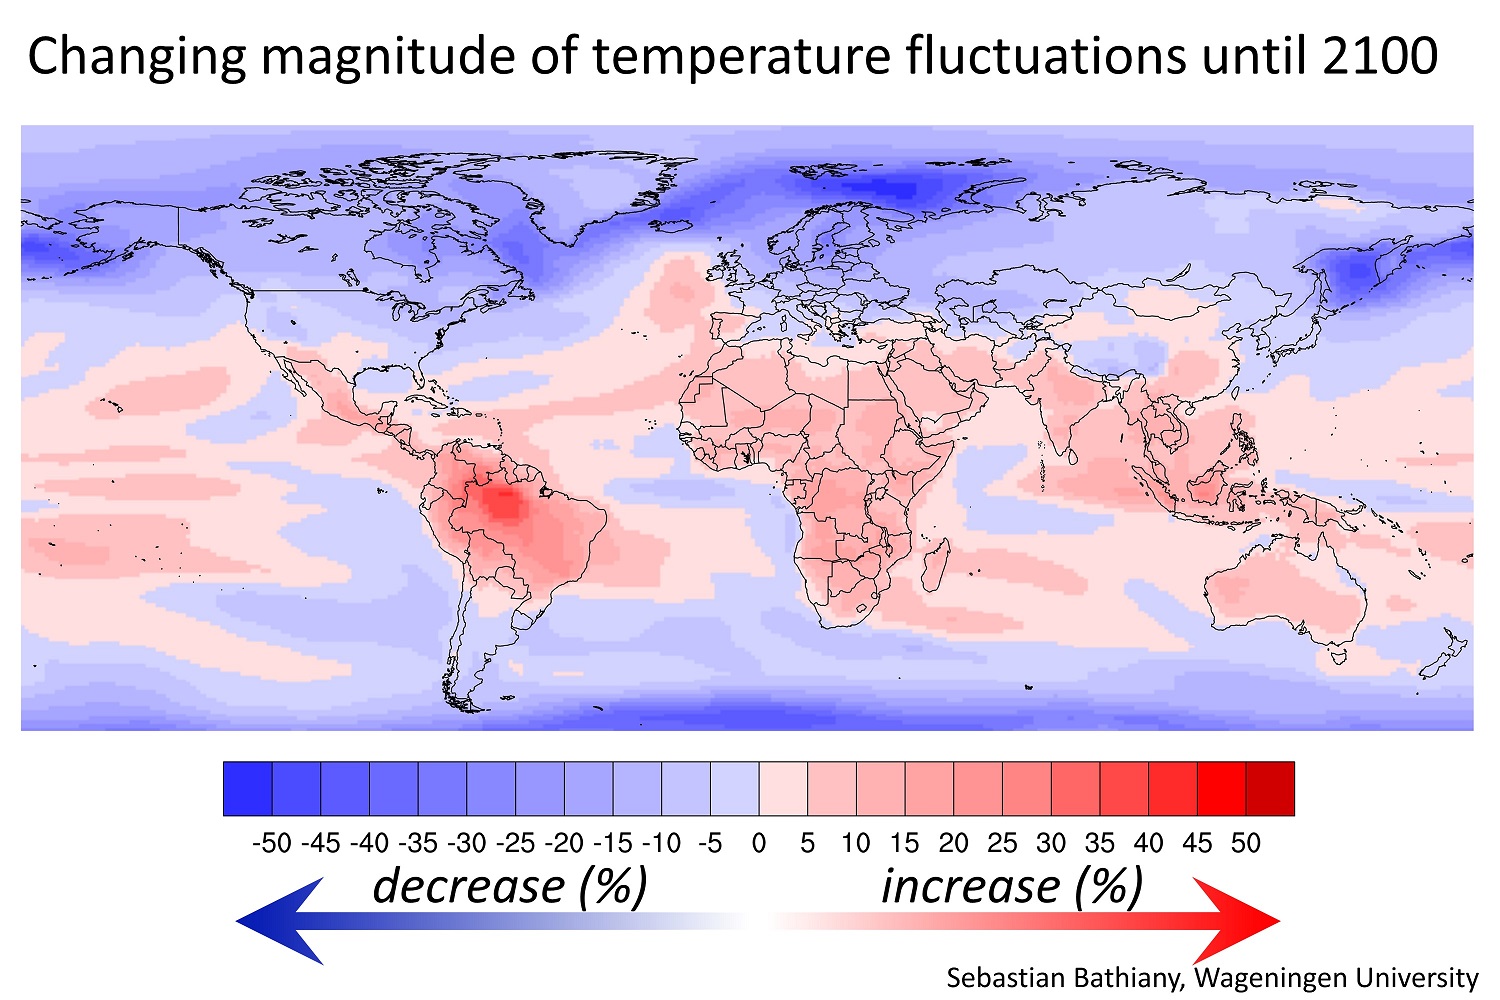
The world’s poorest countries face the largest temperature swings as result of climate change, a brand new NESSC-publication finds. The study by NESSC-researcher Sebastian Bathiany (Wageningen University), published in Science Advances, maps out the changing magnitude of temperature fluctuations for the entire planet. The results show that predominantly tropical countries will see future increases in temperature variability.
Bathiany, together with colleagues from France and the United Kingdom, used over 35 different climate models to study the temperature variability of the earth up until the year 2100. They found that temperature variability is predicted to decrease outside of the tropics, but that it will predominantly increase in tropical countries. Per degree global warming, variability increases up to fifteen percent in Amazonia and Southern Africa, and by up to ten percent in the Sahel, India and South East Asia.
Climate injustice
The study also finds that most of the large swings in temperatures in the tropics are associated with droughts, suggesting challenges for food and water supply for many people living in these countries – which are often too poor to deal with these challenges.
The results point to a previously overlooked climate injustice, says Bathiany: “The countries that have contributed least to climate change and have the least economic potential to cope with the impacts, are facing the largest increases in temperature variability.”
Interested? Read more about the new research here!
Publication:
Climate models predict increasing temperature variability in poor countries
Sebastian Bathiany, Vasilis Dakos, Marten Scheffer and Timothy M. Lenton
Science Advances, 2 May 2018.
doi: 10.1126/sciadv.aar5809